
By Erik Larsen
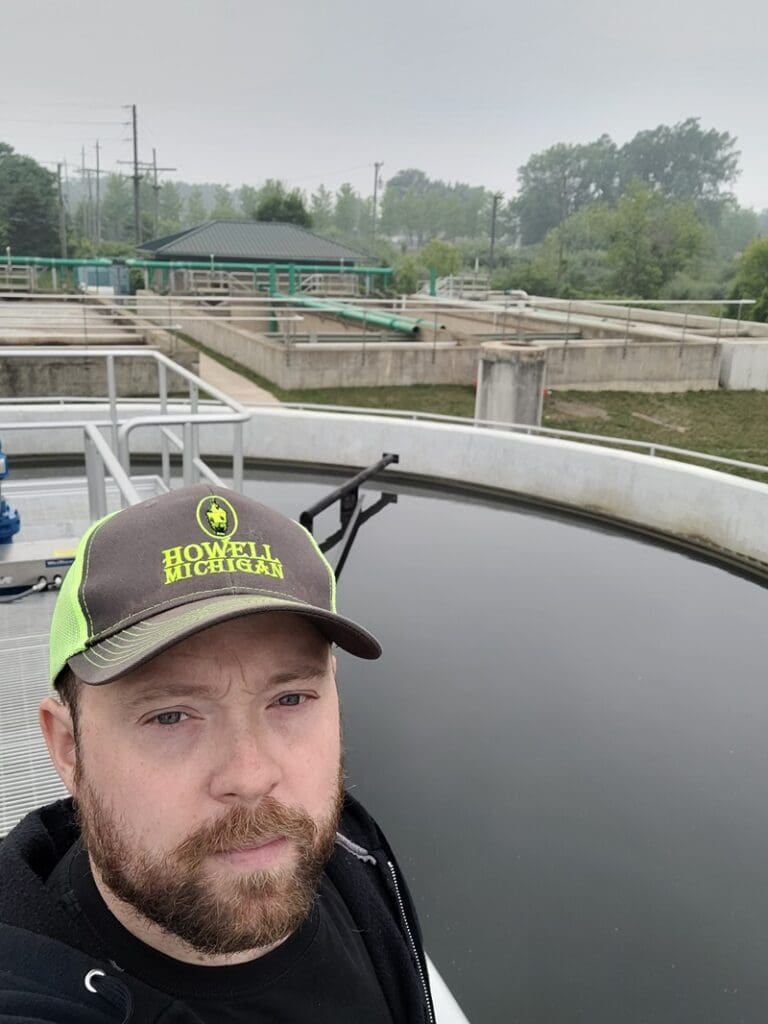
The City of Howell is the largest city in Livingston County, Michigan, with approximately 10,000 residents, and has significantly improved operations at its Class B wastewater treatment facility. The plant processes about 2 million gallons daily and recently implemented a biological nutrient removal (BNR) system that substantially reduces chemical usage for phosphorus removal. Plant Manager Scott Reece oversees operations with a team of four operators, bringing valuable experience from various wastewater facilities.
“We’re rated to treat 2.4 MGD on average with a peak capacity of about 6 MGD, and we have some contingency for a maximum peak flow of around 11 MGD, but this is far in excess of what we have ever experienced even with a very heavy rain event. The new BNR is a great upgrade to our facility,” said Reece.
With construction completed, Reece now manages daily plant and laboratory operations, handling everything from maintenance to reporting. A key improvement has been implementing WIMS (Water Information Management Solution), specialized software designed for wastewater facilities by Aquatic Informatics.
From Paper to Digital Data Management
Operators continuously collect measurements including pH, temperature, ammonia, phosphorous, total suspended solids (TSS), and biological oxygen demand (BOD). Before WIMS, staff recorded data on paper bench sheets before manually transferring it to Excel.
“The work was tedious, and it was easy to fall behind because we all prefer fieldwork to office data entry,” notes Reece.
For the past six months, operators have entered data directly into digital bench sheets that mirror their familiar paper forms. “Right now, operators are entering data into the desktop, but our plan is to go mobile with Rio and use a tablet, or laptop, so we have more freedom to collect data wherever we are collecting it,” said Reece.
The facility’s on-site laboratory tests for ammonia and phosphorous, with results entered directly into WIMS, providing Reece with immediate access to critical data.
Real-Time Monitoring through Customized Dashboards
Dashboards are extremely helpful in getting a quick snaphot of where things are at, especially when they are customizable. Reece said, “When I log in, the KPI’s that are important to me pop right up. The program does the calculations which saves me time and enables me to instantly know what is going on in the plant when I start my day.”
Alerts are set to flag anomalies, or any type of event that operators wants to be notified about. These can be selected to display on the dashboard so decision-makers can easily view the data and make informed decisions.
“Our BNR system is bit finicky, and if it gets out of whack, I’ll get an alert and if we see phosphorous going up I can start to add ferric chloride to the system,” said Reece.
Prior to the software, Reece would review the paper bench sheets, and see that something is amiss and either handwrite a trend, based on the data or do it in excel. Now the program has done all the calculations and shows the trend in the dashboard.
Reece said, “In this kind of a situation it definitely saves me a couple hours. It can take 30 minutes to an hour just going through data, whereas now I see it instantly on my dashboard.”
“Anytime I can eliminate sitting in front of a screen and entering data, I’m happy. I like to go out and help the guys or at least physically oversee what we’re doing on the day to day,” said Reece. “The less time I spend at the computer means I have more time to do other things like focus on quality control and spend more time in the lab.”
Streamlining Regulatory Compliance
Perhaps the most significant time savings comes from automated report generation, particularly for the monthly Discharge Monitoring Report (DMR) required by the State of Michigan.
Reece said, “Sometimes I would have 30 plus days of data that needed to be entered in order to generate a DMR report. And on top of that I would have to do the necessary calculations to provide the data needed. The whole process could consume hours of my day. Now it’s about 30 seconds or so for me to generate the report.”
Reece is working to incorporate additional quarterly and annual reporting into WIMS. The system integrates both SCADA and manually entered data while flagging values outside set parameters, making it easier to identify and investigate anomalies.
After six months of using the system for reporting, the city is working with Michigan state officials to transition to paperless reporting. Reece is developing an assurance plan to demonstrate the system’s audit capabilities to compliance coordinators.
Periodically, compliance auditors will come to the plant, and ask to see all data on a particular day, going back to any point in time. Reece will have to pull all the paperwork to back up the report to show proof that the numbers are not misrepresented. Having centralized digital records will streamline these audits to a few clicks, potentially enabling remote reviews.
“We are always looking for ways to be more efficient, and while the goal here is to be able to send DMR’s directly from WIMS, we can also streamline the audit process which is helpful for both us and the State,” said Reece.
Future Technology Integration
Reece said, “We’re recording a large amount of telemetric data with sensors including everything to do with flow, pumps, valves etc., and then if you multiply that by the number of lift stations, it amounts to stacks of paper. This is why we want to add Rio – having all that information in a digital format will be great.”
Rio is the mobile form of WIMS that helps operators collect and organize data into actionable insights in the field. It can pull data from instruments and allow personnel to capture data on-site with a connected mobile device. “We’re going to put a tablet in the hands of each operator on each side of the city, so they can complete their work on site, and I don’t need to roll a truck to see what’s going on, it will automatically go into WIMS.”
The facility occasionally sends samples to external laboratories for specialized testing, such as mercury and PFAS analysis. Currently, these results arrive on paper and require manual entry. The city hopes to connect these labs directly to WIMS, eliminating another paper-based process.
“There is a lot more that we know we can do with the program, for instance, we can connect our Hach DR3900 that can run the phosphorous testing and put the results directly into WIMS. All the little time savers add up, I just need the time to implement them.” said Reece.
Reece, who shares his experiences through his blog “The Grit Channel,” remains dedicated to improving efficiencies at Howell’s wastewater treatment plant.
“Utility budgets are tight, and if we buy something we are stuck with it, it better work – every dollar counts. WIMS is already making a big difference in the way we do things, and we still have a lot more functionality to unlock.” concluded Reece.

Erik Larsen is product marketing manager for Aquatic Informatics. He is a digital solutions expert with a special focus on artificial intelligence and machine learning, data and analytics, and managed services.


Leave a Reply