The Economics of Leak Detection

Taking the Guesswork Out of Water Loss Management with Auditing & Analysis

By Lucy Andrews, Reinhard Sturm & Kris Williams

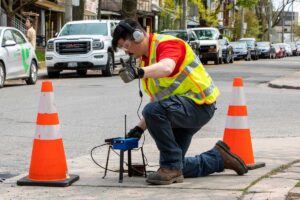
The decision to deploy leak detection crews can be difficult. Utility managers often ask, “Will we find enough leakage to justify the expense of hiring leak detection technicians?” Answering this question doesn’t take cloud-based-solutions or machine learning, it just requires a little careful reasoning. American water utilities frequently lose more than 50 gallons per service connection per day to leakage based on self-reported water audits submitted to state agencies (source: WRF project 4639). This rate of loss may or may not justify deploying leak detection crews depending on the condition of the infrastructure and the miles of mains that must be surveyed.

We’ll draw upon our experience working with water utilities throughout the United States to depict a case study that exemplifies many of the characteristics we’ve encountered through our work. The case study utility, which we’ll call “Waterbury,” has been considering expanding leak detection efforts for several years, but the utility is not certain it can justify the expense.

Figure 1

Figure 1 – Leak Detection Analysis Framework (AF)

Figure 1 outlines the steps it must take to evaluate leak detection as a water loss control strategy. After determining the volume of recoverable leakage through leak detection, we can value the lost water and compare it to the cost of leak detection. This basic analysis provides a simple payback period for the upfront investment. The last step assesses the rate at which leaks return to the system and how to mitigate them in the long-term.

Determine the Volume of Recoverable Leakage

Figure 2

Figure 2 — Waterbury’s audit results for the last five years

The first and best place to start investigating water losses is an AWWA water audit. An AWWA water audit quantifies the total volume of water lost to leakage. Waterbury’s audit results for the last five years are summarized in Figure 2. Waterbury hasn’t performed significant leak detection recently, so the volume of leakage has increased because leakage accumulates in the absence of proactive response. The water audit process involves a bit of uncertainty so some years show less loss than the previous year, but the general trend is clear.

Waterbury can recover a portion of the volume of leakage through leak detection. To estimate that volume, Waterbury must complete a component analysis of real losses. A component analysis determines a utility’s unique leakage profile by eliminating forms of loss that are not recoverable through leak detection. As a starting point, the total volume of real loss from Waterbury’s most recent audit, 2,360 analysis framework (AF), is shown in Figure 3.

figure-3

Figure 3 – Waterbury’s most recent audit.

To begin a component analysis, Waterbury models background leakage, the volume of water that is seeping and dripping from pipes at low flow rates and cannot be heard using traditional leak detection equipment. Background leaks are common in all systems and often account for more than half the total volume of leakage. If you’re hoping to recover background losses, your best option is likely pressure management, but that’s a topic for another article.

Utility staff determined that Waterbury lost 960 AF to background leaks during the audit period using standard methodologies described in WRF project 4372A. Background leakage, shown in gray in Figure 4, is modeled using the count of service connections, the miles of main pipe and the average operating pressure.

Figure 4

Figure 4 – Background Leakage: Seeps and drips that cannot be detection using traditional leak detection equipment.

After modeling background leakage, Waterbury must quantify the volume of water lost to leaks repaired during the audit year. Waterbury has to distinguish between leaks that were called in, or reported, and leaks that were found proactively through existing leak detection efforts.

Waterbury’s volume of reported leakage is a function of the number of leaks they repaired, their flow rate, and duration. Like many agencies, Waterbury has basic repair records that indicate the size and type of leaks repaired during the audit period, but staff do not estimate the leak flow rates and durations. Based on industry standard flow rates and leak run-times, staff can estimate the total volume of leakage attributable to reported leaks as 78 AF. Often the total volume of loss from reported leaks, including major main breaks that make the news, is a fraction of the total volume of leakage in any given year.

Figure 5

Figure 5 – Reported Leakage: Repaired leaks that were reported to the utility by the public or staff conducting regular maintenance.

Leaks that Waterbury discovered through proactive leak detection are considered unreported leaks. During the most recent audit period, Waterbury performed basic pilot leak detection in 10 percent of their system to evaluate potential leakage recovery in the field. Like reported leakage, the volume of unreported leakage can be estimated using industry standard flow rates and durations. However, unreported leaks typically have longer durations and lower flow rates than reported leaks. Using the estimates for unreported leak run-times and flow rates, system staff calculate that Waterbury lost 127 AF to leaks found through proactive leak detection during the audit period.

After accounting for background, reported, and unreported leakage, Waterbury is left with the total volume of hidden leakage, shown in blue in figure 6. Based on this analysis, during the most recent audit year Waterbury lost 1,073 AF of water to leakage that could have been recovered through leak detection. Waterbury has not yet attended to these leaks, so they will continue to flow, and maybe even worsen, as time goes on. To understand the appropriate response to this hidden leakage, Waterbury first must value it.

Figure 6

Figure 6 – Unreported Leakage: Repaired leaks that were found through existing proactive leak detection efforts.

Though many justifiable methodologies exist for valuing leakage, an assessment of avoided production and distribution costs is a conservative place to start. If you save a volume of leakage (for example, 1 MG or 1 AF), you would also save the costs of producing and distributing that leakage. Typically, these production and distribution costs include water acquisition (withdrawal rights or import costs), treatment chemicals, and pumping electricity. Assessing these costs on a per-unit basis conservatively values your volume of hidden loss.

Additional costs of leakage, like depreciation on pumps or liability paid out for property damage, may be more difficult to quantify. Waterbury has decided to stick with the basic direct costs of production and delivery and knows that the value of $425/AF is likely an underestimate of the true cost of leakage. Based on the conservative per-unit value of $425/AF, Waterbury is losing about $450,000 annually to leakage that is potentially recoverable through leak detection.

Determine the Cost of Intervention

Most leak detection contractors charge per mile of main surveyed. Waterbury will select a reputable service provider that can guarantee a comprehensive survey – listening to every accessible appurtenance in the system, including services, valves, and hydrants. A comprehensive acoustic survey typically provides better return on investment than a cheaper but much less thorough “general” survey. General surveys usually only listen to hydrants that are spaced too far apart to reliably detect leak noise.

Waterbury operates 650 miles of mains, and the leak detection contractor quoted the total cost to survey the system at $195,000.

Waterbury did not include the cost of leak repair in the total survey cost because identifying leaks does not introduce repair costs; Waterbury would eventually have to repair the leaks anyway. In fact, it’s likely that proactive leak detection would reduce the total cost of leak repair for Waterbury in the long run by attending to leaks before they surface and become potentially destructive.

Figure 7

Figure 7 — Financial losses over time.

Evaluate Return on Investment

Before thinking long-term, Waterbury focuses on removing the backlog of hidden leakage that has accumulated in the system. By comparing the cost of the full-system survey to the value of recoverable leakage, Waterbury can estimate a simple payback period for these efforts. Figure 7 shows how the financial losses accrue over time if leaks aren’t repaired. The simple payback period for Waterbury is the timeframe in which the total value of cumulative loss exceeds the cost of leak detection, assuming the leak flow rates remain constant. In this case, if the total volume of hidden losses were recovered in a single survey, the effort would recoup its cost within six months. In order to recover all hidden leaks, Waterbury might need to survey the system more than once. Even if this is the case, the payback period is very short, as is frequently the case in our experience.

Despite the attractive return on investment suggested by their initial analysis, Waterbury is not confident in some of the data used in the water audit. Before committing to surveying the full system, Waterbury decides to spread its investment over two years by surveying half of the system annually in an expanded pilot program. If leak detection results validate the return on investment suggested by this basic analysis, Waterbury will continue identifying additional leaks in ongoing surveys of remaining infrastructure.

Additionally, a single leak detection survey covering all system mains may not identify all hidden leaks because the noise from one leak might mask another nearby. Therefore, Waterbury might need to perform several successive surveys to recover all hidden leaks. Even if multiple surveys are required, the return on investment remains attractive.

Develop a Long-Term Strategy

Waterbury’s long-term strategy depends on how fast new hidden leaks develop in their system. The more quickly new leaks develop, the more frequently Waterbury should perform leak detection. However, if Waterbury surveys too often, they will spend more money on leak detection than the value of the leakage they recover.

Figure 8

Figure 8 — Theoretical losses after full survey and partial survey every year.

Figure 8 is a simplified illustration of hidden leak recovery after a year of intensive leak detection and repair. New hidden leaks develop at predictable rate, referred to as the rate of rise (“RR,” shown in light blue). The rate of rise can be estimated using successive leak detection surveys, consecutive water audits, or industry standard estimates.

The balance between the cost of frequent surveying and the value of water lost to leaks can indicate the optimum percentage of the system that should be surveyed on an annual basis. Once we’ve assessed Waterbury’s rate of hidden leakage development, we must determine how long it takes to accumulate leakage whose value equals the cost of leak detection. In Waterbury’s case, this takes 32 months. As a result, Waterbury 

Figure 9

Figure 9 — Economic Intervention Frequency

should either survey their system once every 32 months or survey about 35 percent of the system every year so that a full survey is accomplished every 32 months. Figure 9 shows how changing survey frequency affects the total cost of a leak detection program for Waterbury (the orange line).

Conclusion

Waterbury now has a plan for reducing leakage based on the volume of leakage the system experiences, rather than guesswork. First, Waterbury will clear the hidden leaks that have accumulated in their system with a full-system survey over two years Waterbury will refine its survey plan as initial results come in.

But the work of leak management doesn’t end with a single survey, since the system will develop new leaks. To combat new leakage, Waterbury will continue surveying a portion of the system every year that balances the cost of leak detection with the value of lost water. Based on some simple economic analysis, Waterbury is planning to survey a third of the system each year after removal of the backlog of leakage. Throughout leak survey and repair, Waterbury will collect data that allows them to track results and refine the cost-benefit analysis of future leak detection efforts.

Waterbury’s case is typical – more frequently than not, a basic assessment of leak detection indicates that a leak survey will provide positive return on investment and a short payback period. Tools and guidance documents developed by the Water Research Foundation (WRF project 4639) and the best practice guidance document for water loss control (AWWA M36) provide all you need to develop a cost-effective leak detection program.


Lucy Andrews

Lucy Andrews is a project manager at Water Systems Optimization (WSO). She works with water agencies across the country to evaluate and combat water loss. Recently, she co-authored Water Research Foundation projects 4372B, 4639A and 4639B, which focused on water audit analysis and validation. She also spearheads a pioneering water loss control workgroup in Orange County and serves as a water audit validator in California’s Water Loss Technical Assistance Program.

Reinhard SturmReinhard Sturm is CEO of Water Systems Optimization. He has worked on water loss management projects around the world, and for the past 13 years, has focused his work on North America. Sturm served as principle investigator on five water loss control-related WRF research studies and is the co-author of the McGraw Hill textbook, “Water Loss Control.”

Kris WilliamsKris Williams is an analyst with WSO and has managed all aspects of water loss control programs for clients from the AWWA water audit to district metered area development. At WSO, his role involves making contributions to the efficiency of deriving insights from large and complex data sets. Williams is also launching a water loss control training and technical assistance program for the state of Hawaii.

Leave a Reply

Your email address will not be published. Required fields are marked *

*