
By Travis Wagner
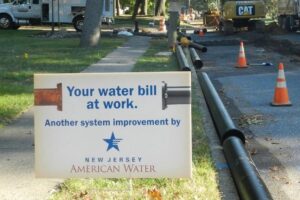
Quantifying the value of water is an overwhelming task. A physical asset evaluation would assume that our national water treatment and pipe infrastructure has a value of over $3.6 trillion with nearly 60 percent of the value underground. A holistic approach would describe the value being essential to all life. Under a global pandemic, a pragmatic acceptance of the value of water entails the “cost of service” to provide high quality drinking water to our hospitals, homes and businesses 24 hours a day, seven days a week, 365 days a year. This cost of service of a water quantity, quality and delivery service level to protect the public health and fight against COVID-19 requires each utility to assess and maintain their underground pipe systems.
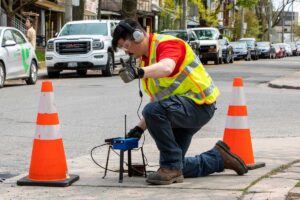
University studies suggest water distribution systems have increased in the number of water main breaks overall by 27 percent in less than a decade. These studies highlight the growing uncertainty of the performance of underground infrastructure and the many variables of installation, soil and climate, material and diameter. This information can help utilities develop pipe cohorts in order to analyze pipe performance, taking into consideration different variables like diameter (pipes 12 in. in diameter and smaller, which represents nearly 85 percent of all water pipe inventories) and other important attributes and operating characteristics. Operational costs is another important variable to track. The Water Research Foundation found that the 10-year average cost of small diameter pipe breaks includes $12,600 in direct costs and another $5,600 in indirect costs. More severe results include boil water notices and commercial business interruptions. For larger diameter water transmission lines these indirect costs increase into the millions and impact city centers. Each break regardless of size interrupts essential water services to fight against the spread of COVID-19 and potentially risks additional water quality public health threats.
A New Pandemic Service Level: Not understanding the condition of water pipes and where the real risks are is no longer acceptable.
This new pandemic service level paradigm intensifies the fiscal challenges which water utilities currently face. At a time when greater investment in our water infrastructure is needed, we now face more volatile cash flow shifts and revenue loss even more than ever seen before. A recent report published by the American Water Works Association (AWWA) indicates utilities will experience a nearly 17 percent revenue and cost impact due to COVID-19 across the United States with delays and reductions in annualized capital expenditures of up to $5 billion. Bluefield Research also estimates a capital expenditure reduction of up to 21 percent by 2024 (see figure below).

Water utilities have faced droughts, flooding events, revenue impacts from water conservation and local economic hardships while struggling with water underground pipe infrastructure repair and replacement uncertainty. Historically, replacing the oldest pipes was the strategy, but as new approaches were developed through asset management practices pipe material, age, diameter became the core decision criteria for pipe renewal and replacement. Now, with the abundance of pipe related data and analytical models, the industry is realizing that age-based methods are not effective in quantifying the risk and uncertainty of water pipe repair and replacement.
Many utilities strive for a goal of replacing 1 percent of their pipe network each year representing a 100- year replacement cycle. The current national metric is 0.8 percent or a 125-year average replacement cycle for water pipes. The primary purpose of these replacements is to avoid service disruptions (leaks, breaks, sinkholes, etc.). These disruptions obviously have documentable economic impacts with revenue loss due to water outage as well as repair costs. Although harder to quantify, larger impacts are found in the social and political spheres through the business disruption of individual, commercial, industrial and governmental stakeholders. Reputation loss is another result of water main break news reports. For example, temporary shutoffs or boil water notices due to a break can impact thousands of customers for days. Typically, replacement of old or failing pipes has been the primary method to address the issue. To guide replacement priorities, most utilities currently employ some form of subjective strategy such as age-based or scoring/matrix approaches (i.e. assigning weights and factors of 1 to 5 for various inputs of likelihood and consequence of failure). The desired intent is to replace the riskiest pipes first to avoid the occurrence and impact of failures.
Click here to SUBSCRIBE to the digital edition of WF&M!
The Great Lockdown Recession and its impacts as forecasted above, once again presents drastic cash flow fluctuations and revenue decreases, and at the same time accentuates the critical assessment of risk and the required strategic investments. An accelerated digital technology approach provides the cost-effective strategy to mitigate the uncertainty and budget gaps now and into the future
Xylem has been focused on water pipeline network replacement and integrity planning for more than five years, delivering to utilities predictive models for their capital water main replacement budgets (e.g. 3-year planning cycles). With years of predictive modeling experience and decades of water network asset management experience, this led to one of the first machine learning based water main break predictive models in North America in 2014 with deployments at DC Water and Howard County, Maryland. Since then, the Xylem team has continuously improved the models and validated the results with real world useful outcomes.
Through many years of data collection and model validating against thousands of miles of pipes, results have demonstrated that older factor-based models can successfully reduce pipe network breaks between 5 percent and 10 percent over three years at an annual replacement rate of 1 percent of the system (see figure below). The figure is based on a 1,000-mile system that averages a break per day and an average cost of replacement of $1 million per mile. The shaded area represents the typical break reduction performance versus the percent of pipe network replaced as guided by the age/scoring/matrix-based risk approaches. This particular utility’s model results (i.e. red dot) helps them achieve a 10 percent reduction of breaks by replacing 3 percent of their pipes over three years.

Utilities have done great work in achieving these results having no clear industry standard to reference in building their prioritization. The underlying challenge with this break reduction rate is trying to keep up with the annual increase in breaks over time as reported by a 2018 report from Utah State University indicating the increase in the US break rate between 2012 and 2018 at 27 percent with cast iron and asbestos cement leading in failures. Comparing a similar replacement timeframe as the data in presented here (e.g. a more than 13 percent break rate increase in 3 years), the effectiveness of the scoring/matrix prioritization model will not keep up with new breaks.
Tracking break reduction versus replacement rate (and spend) is important to ensure the utility is getting the most out of their investment and this benefit is felt by the rate payers – a reduction in breaks will result in decreased impacts to the utility, community, and environment.
Pandemic Water Service Delivery Expectation: Water utilities face the challenge of balancing customer expectations that water service delivery will not be jeopardized by a reduction in revenue or a delay in capital spending. This determination can only be made utilizing advanced digital and analytical methodologies.
An Example:
Using an assumed utility pipe network size of 1,000 miles, an annual replacement rate of 1 percent and average cost of $1 million per mile for replacement, the annual budget is $10 million per year.
Over the past six years, a team has developed a predictive water main break solution (called RiskView) that employs an advanced multi-model approach that has been shown to achieve a much higher level of break reduction for each mile of pipe replaced. This is illustrated in the figure below. The blue shaded area represents the typical performance of Xylem RiskView based on dozens of models for utilities. Through the digital transformation of water utilities evolving from their traditional age-based approach to pipe attribute scoring/matrix approach to ultimately utilizing RiskView, the utility will have a more effective replacement program (typically by more than 5X).

Risk Mitigation Strategies for 2020 COVID-19 Budget Impacts
So how can RiskView help in times of budgetary restrictions? Using the output of RiskView to drive replacements rather than more traditional models, utilities can leverage RiskView results to maintain their current level of service with reduced budgets. This is shown in the figure below. The “red dot” moves to the left, maintaining the same level of break reduction with a greatly reduced budget.

In the example shown above, the budget reduction potential is between 55 to 90 percent while still maintaining a 10 percent break reduction. Utility managers can now reduce breaks in an equal amount as before and replace far less pipe. As previously noted, no models are perfect. However, conservatively speaking, utilities could use the RiskView output to justify cuts to their replacement spending in half or more while maintaining the same break reduction targets in acceptance today with traditional risk models. Ideally, as the world stabilizes from the pandemic with revenue and capital spending becoming more predictable, utilities can then use the RiskView output to begin reinvesting in renewal and replacement activities with a much higher break reduction rate than in previous years.

RiskView represents the revolutionary upgrade in pipe risk assessment approaches and planning methodologies. A water utility has the potential of moving from reducing 7 percent of breaks to nearly a 35 percent reduction in main breaks. In the given example, the emergency break repair savings can shift from 77 fewer breaks for a $970,200 savings to 383 fewer breaks for an estimated $4,825,800 in savings over three years.

Under the new era of pandemic readiness, water utilities are an essential and critical infrastructure system required to maintain the ability to fight against the spread of COVID-19 and protect the ongoing public health needs. Given the financial impacts from commercial shutdowns and shelter in place recommendations, water utilities are experiencing a constriction of cash flow and likely a long-term reduction in capital investments. However, strategic investments will need to be made in a proactive manner in order to assure the public that high quality drinking water services are continuously available and are not in jeopardy. Also, that water affordability will not be overlooked due to short-sighted budget cuts which creates premature asset failures and an increase in expensive emergency repairs and replacement events. Water utilities are faced with the challenge to assess and analyze the risks associated with capital spending delays. RiskView provides a risk assessment methodology to justify budget reductions while maintaining current service level expectations. RiskView provides assurances during times of uncertainty. Technology advancement, acceptance and investment can build more resilient, sustainable and affordable water utilities of the future.
Travis Wagner, P.E., is vice president and global practice manager, asset management, for Xylem. He has more than 17 years of experience providing leadership in the development and implementation of water sector asset management solutions offering innovative, yet practical insights for utilities to optimally manage their infrastructure. His passion is helping utilities turn data into decisions combining a breadth of experience in asset management, planning, data science software/solutions development, design and asset integrity within the water sector.


Leave a Reply