The U.S. Geological Survey (USGS) has released the first nationwide tool to help city planners determine if communities have enough water for current and future needs.
According to a news release from USGS, nearly 27 million Americans, or 8% of the population, live in areas where water demand approaches or exceeds supply. Accessing comprehensive information on water sources and availability required communication across multiple agencies and often navigating fragmented datasets. The new tool from USGS is designed to eliminate many of those barriers.
The tool, called the USGS National Water Availability Assessment Data Companion, provides water managers, agricultural communities and researchers with detailed information about water supply and demand across approximately 80,000 watersheds nationwide.
“While the United States has abundant water nationally, regional imbalances between supply and demand may create water challenges affecting millions of Americans,” said Shirley Leung, lead scientist. “This tool can help decision-makers understand whether challenges may stem from limited natural water supply, high demand, or both. This information is helpful for effective water planning.”
According to USGS, planners in water‑rich regions may also make use of the tool to identify potential economic opportunities tied to their water supply, as well as to support long‑term resource planning.
Why the Tool is Unique
According to USGS, more than 224 billion gallons of freshwater are withdrawn daily across the lower 48 states for municipal water supply, crop irrigation and power generation. Historically, understanding where and when this demand intersects with water availability required difficult-to-access data.
The National Water Availability Assessment Data Companion is the first tool to provide water availability data from individual watersheds on a national scale, using USGS models that integrate monitoring data, satellite observations and climate information. Users can access up to 40 years of monthly water supply information, including streamflow, snowpack and soil moisture data. Data comparing supply and demand are available from 2009 to 2020. Public supply, crop irrigation and water supply data extend from 2000 to 2020.
“Public access to data is a cornerstone of the National Water Availability Assessment,” said Leung. “What once required significant resources and time can now be done in minutes, giving communities of all sizes the same foundation for water planning.”
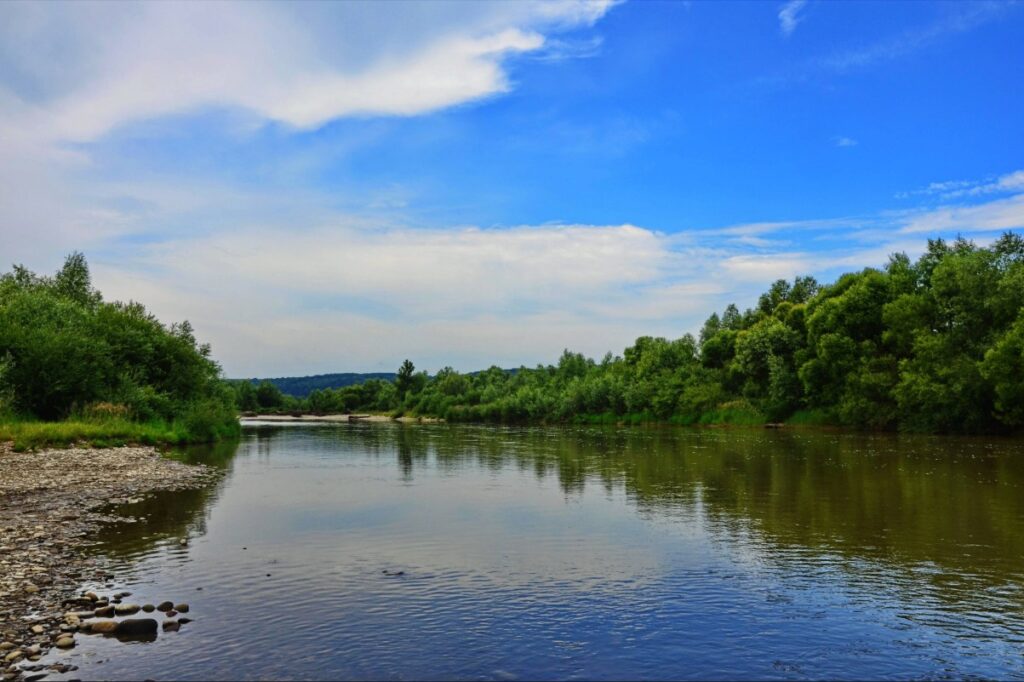
Regional Patterns
The data reveal how water availability varies significantly across the country:
The Mississippi Embayment — including parts of Arkansas, Louisiana and Mississippi — receives the nation’s fourth-highest natural water supply from rainfall and river flows. However, in 42% of the area, intensive crop irrigation for rice and cotton drives water demand to levels that approach or exceed natural supply.
The Central and Southern High Plains — including areas of Kansas, Nebraska, Oklahoma and Texas — face challenges from both limited precipitation and substantial irrigation demand for corn, soybean and cotton crops.
The Southwest — including portions of Arizona, Nevada and New Mexico — has naturally limited water supply combined with municipal and agricultural demands that strain available resources.
California’s Central Valley exhibits significant seasonal variation. Water supply-demand imbalances increase substantially during summer months when irrigation demands peak and natural supply decreases.
Accessing the Data
Users can explore conditions for any watershed, compare regions, identify seasonal patterns and download complete datasets in multiple formats for custom analysis. Technical users can access the data through web services and easily integrate it into their local workflows for a variety of purposes, such as building models, developing tools, or conducting data analysis.
Access the National Water Availability Assessment Data Companion online here at no charge.
Source: U.S. Geological Survey


Leave a Reply